
June 14th, 2025
Via Visual Capitalist, a look at subsidence in the U.S.:
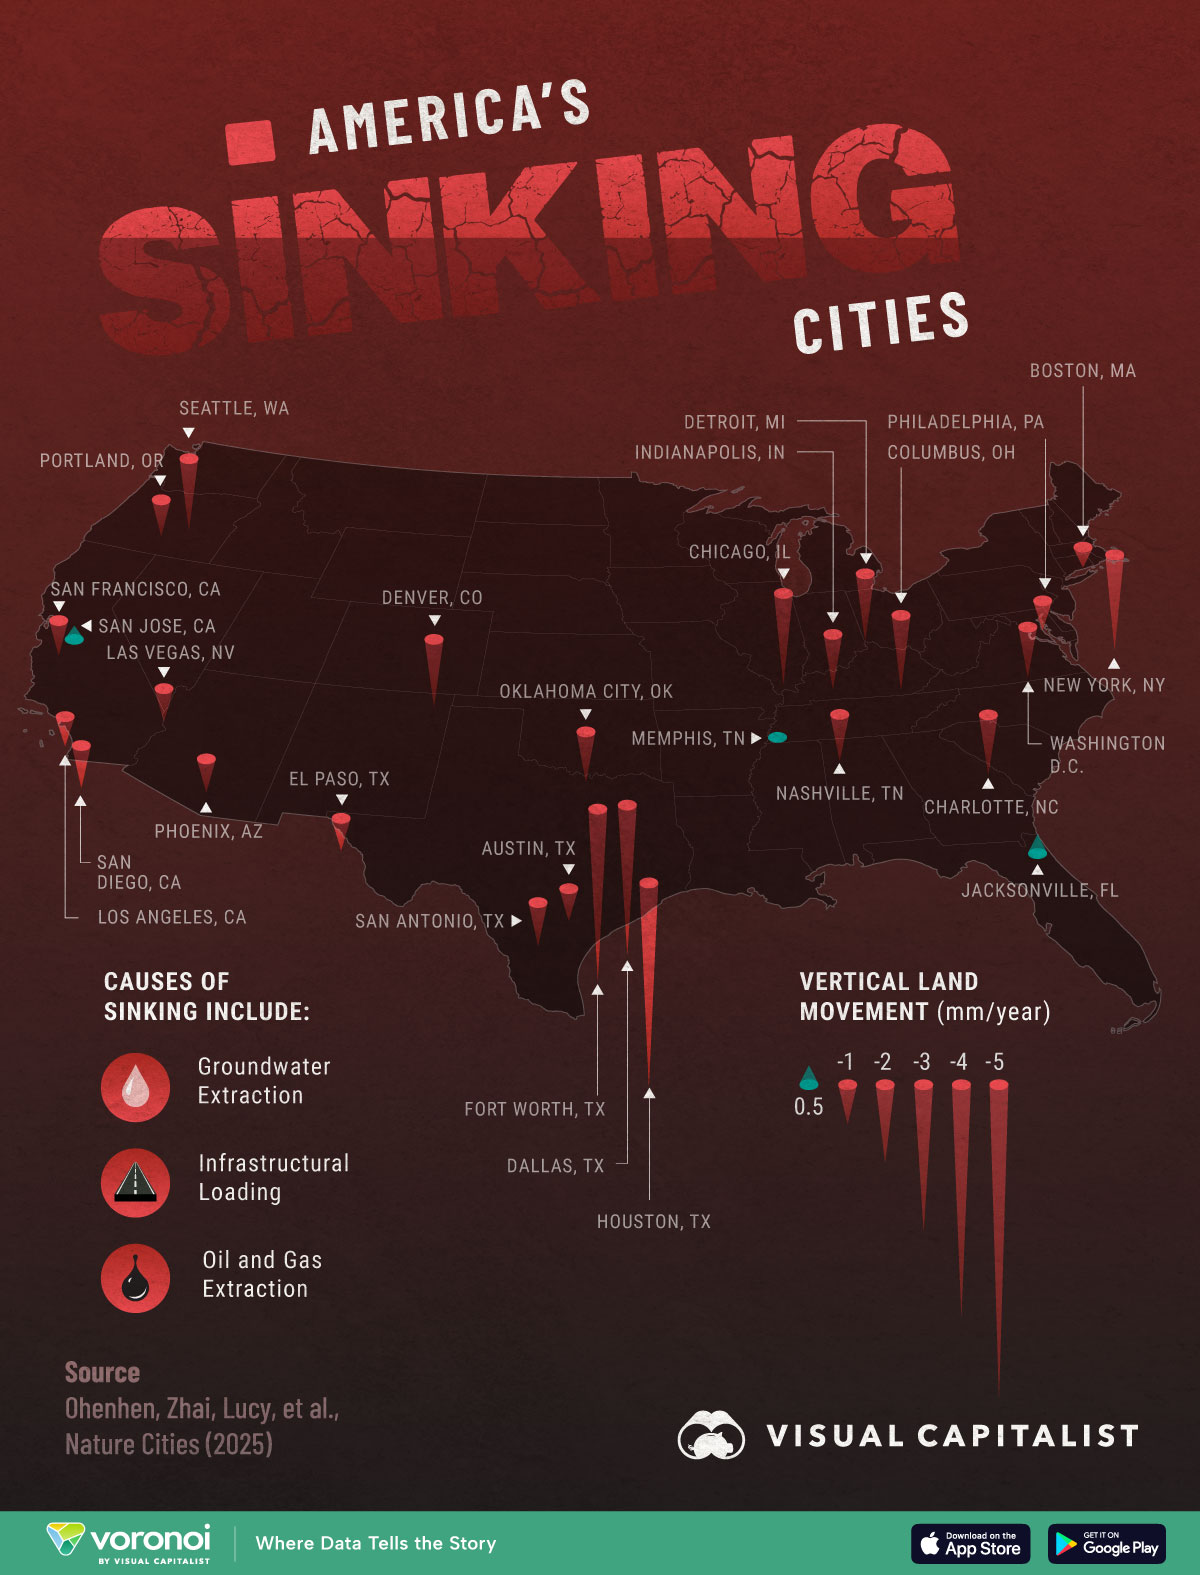
Across the U.S., major urban centers are experiencing significant land subsidence, a.k.a the sinking of land.
This map visualizes the average vertical land movement within 28 of the largest U.S. cities from 2015 to 2021, measured in milimeters per year.
Data comes from a 2025 Nature Cities study titled “Land subsidence risk to infrastructure in US metropolises” by Ohenhen, Zhai, Lucy, et al.
Which U.S. City is Sinking the Most?
Below, we show the average vertical land movement within 28 of the largest U.S. cities from 2015 to 2021, measured in millimeters per year.
A recent study found that 25 of the 28 largest U.S. metropolitan areas are sinking each year, with cities in Texas experiencing some of the most severe land subsidence.
Out of the cities studied, Houston was the city experiencing the most drastic subsidence, sinking 5.216 milimeters per year on average.
This gradual sinking can worsen the impacts of sea-level rise, increase flood risk, and place additional stress on urban infrastructure, particularly in densely developed areas.
The primary cause of this subsidence is groundwater extraction, though other contributing factors include the weight of urban development, oil and gas extraction, and glacial isostatic adjustment—a slow shift in the Earth’s surface due to the long-term melting of ancient ice sheets.
The study authors estimate that a total land area of 17,900?sq. km. is sinking across these 28 cities.
'Black Swans' are highly improbable events that come as a surprise, have major disruptive effects, and that are often rationalized after the fact as if they had been predictable to begin with. In our rapidly warming world, such events are occurring ever more frequently and include wildfires, floods, extreme heat, and drought.
'Green Shoots' is a term used to describe signs of economic recovery or positive data during a downturn. It references a period of growth and recovery, when plants start to show signs of health and life, and, therefore, has been employed as a metaphor for a recovering economy.
It is my hope that Black Swans / Green Shoots will help readers understand both climate-activated risk and opportunity so that you may invest in, advise, or lead organizations in the context of increasing pressures of global urbanization, resource scarcity, and perils relating to climate change. I believe that the tools of business and finance can help individuals, businesses, and global society make informed choices about who and what to protect, and I hope that this blog provides some insight into the policy and private sector tools used to assess investments in resilient reinforcement, response, or recovery.